Staff (Government/Factcheck Desk) – May 22, 2025
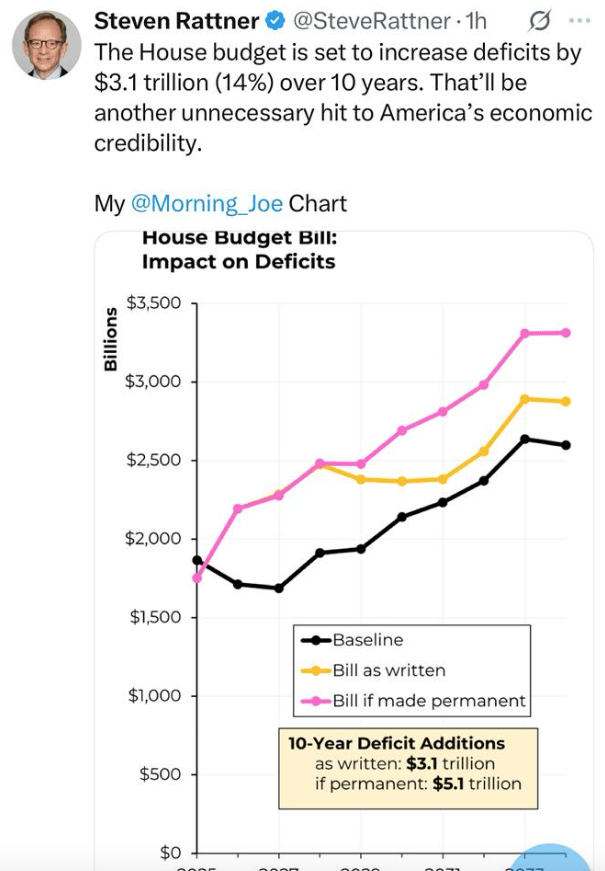
In response to our report, The Big Beautiful Bill (TBBB): The Good, the Bad, and the Ugly for Americans, a reader shared a meme from Steven Rattner (D) claiming the TBBB would add $3.2 trillion to the national deficit over ten years. To provide context, we note that under President Biden, the national debt rose by $8.4 trillion in just four years (January 2021–January 2025). Here’s a clearer breakdown of Biden’s contribution and how it compares to the TBBB’s projected impact:
- Biden’s $8.4 Trillion Debt Increase (2021–2025):
- Total Debt Growth: The national debt grew from $27.8 trillion to $36.2 trillion over four years.
- Direct Policy Impact: The Committee for a Responsible Federal Budget estimates Biden’s legislation and executive actions added $4.7 trillion to the ten-year debt, including:
- American Rescue Plan ($2.1 trillion).
- Bipartisan Infrastructure Law ($440 billion).
- PACT Act ($520 billion).
- Social Security Fairness Act ($230 billion).
- Executive actions (e.g., student loan relief, SNAP increases: $1.2 trillion).
- Offset by $1.9 trillion in savings (e.g., Fiscal Responsibility Act).
- Other Factors: The remaining ~$3.7 trillion stems from pre-existing mandatory spending (e.g., Social Security, Medicare), rising interest costs due to inflation-driven rate hikes, and economic recovery dynamics.
- Annual Deficits: Ranged from $1.38 trillion (2022) to $2.78 trillion (2021), totaling ~$7.7 trillion, with the rest from inherited commitments.
- TBBB’s Projected $3.2 Trillion Deficit Increase (2025–2034):
- Timeframe: Spread over ten years, averaging ~$320 billion annually.
- Key Drivers: Nonpartisan estimates (e.g., CBO: $2.3 trillion; Penn Wharton: $3.3 trillion; CRFB: $3.3–$5.2 trillion) highlight tax cuts ($4.6–$7.7 trillion, including 2017 TCJA extension, no taxes on tips/overtime), $321 billion in new spending (border security, defense), and $1.5–$3.9 trillion in spending cuts (Medicaid, SNAP, green energy). Tariff revenue ($1 trillion) is uncertain.
- Context: The TBBB’s deficit impact is policy-driven, with front-loaded tax cuts and back-loaded offsets, unlike Biden’s mix of policy and autopilot spending.
- Comparison:
- Scale: Biden’s $8.4 trillion over 4 years ($2.1 trillion/year) dwarfs TBBB’s $3.2 trillion over 10 years ($320 billion/year) in annual impact.
- Attribution: Only ~$4.7 trillion of Biden’s debt is from new policies, while TBBB’s $3.2 trillion is nearly all policy-driven.
- Context: Biden faced post-COVID recovery and high inflation, inflating costs and revenues. TBBB assumes modest growth but risks higher deficits if cuts or tariffs underperform.
We encourage readers to engage with these numbers critically. Follow us on X at https://x.com/BWRORG for fact-checks and context, and subscribe at www.blackwaterreports.org for instant report updates. Share your thoughts—what’s your take on these fiscal impacts?

Leave a reply to Paula Fraver Cancel reply